.svg)
Multi Rating Pro itself has limited data analysis and reporting capabilities built in. But it does have a little known feature to export ratings to a CSV file, thus enabling you to use spreadsheets for all of your data analysis and reporting needs. This article assumes you have a basic knowledge of spreadsheets and how to setup a PivotTable and a PivotChart in Microsoft Excel.
Let’s assume your ratings data spreadsheet looks like this.
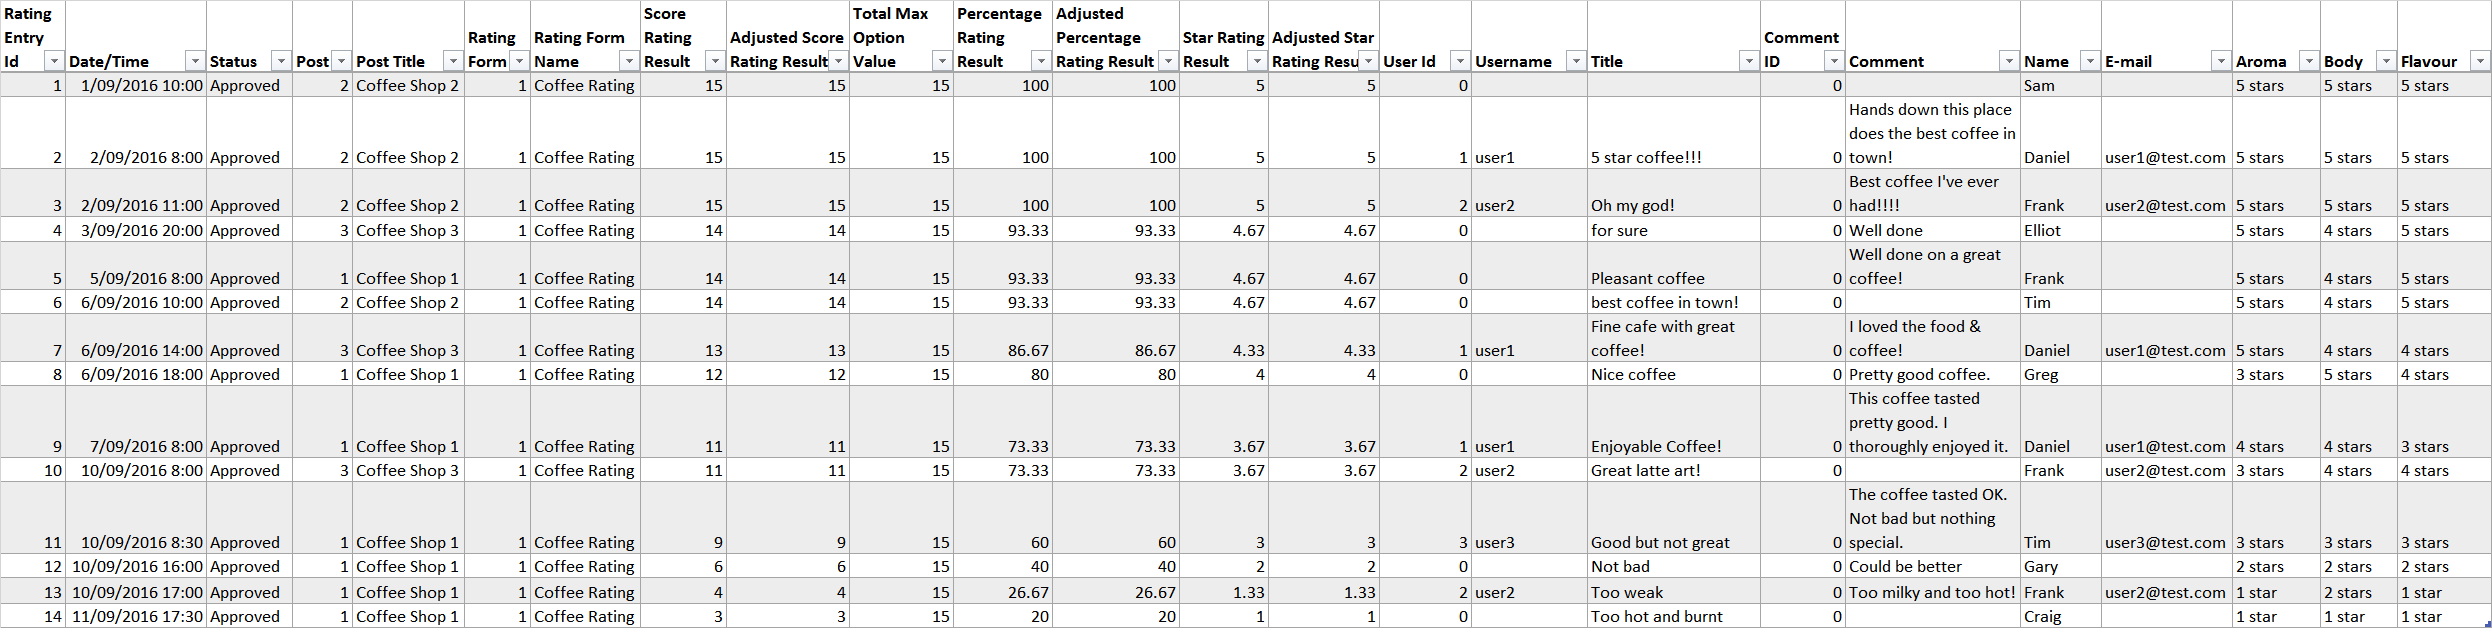
Click here to download a copy of the raw unformatted CSV file.
Here are some examples of questions you can answer and custom reports you can create with spreadsheet software such as Microsoft Excel or Google Sheets.
- What is the average rating given per user?
- What is the count of ratings given per user?
- What is ratio between anonymous and logged in user ratings?
- Filter ratings by a selected rating item value
- Create a report of ratings over time for specific posts
- Create a bar chart of selected rating item values for a specific rating form and post
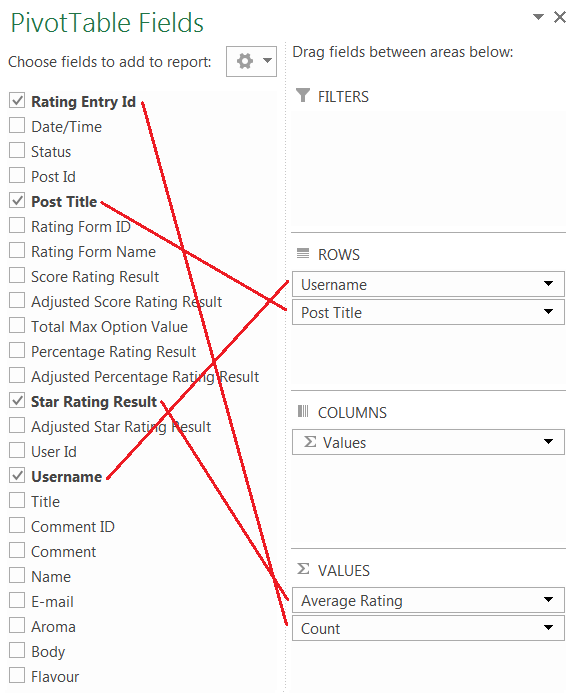
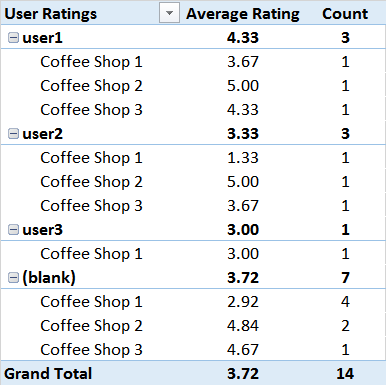
What is the average rating given per user?
Create a PivotTable, with Username and Post Title rows, and then add values for the average star ratings and a count of Rating Entry Id’s. Note the (blank) users are anonymous.
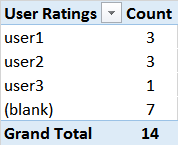
What is the count of ratings given per user?
Create a PivotTable, with Username row and count of Rating Entry Id’s as the value. Note the (blank) users are anonymous.

What is ratio between anonymous and logged in user ratings?
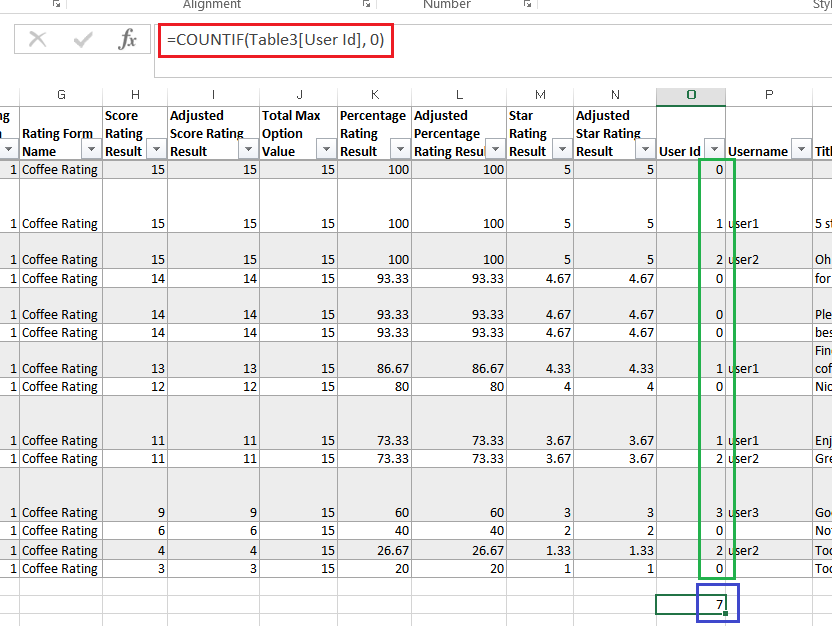
You can use the formula =COUNTIF(Table3[User Id], 0) to count all User Id’s which equal 0 (meaning an anonymous user). Likewise if you want to count ratings by logged in users only, you can modify the formula to count values not equal to 0 as follows =COUNTIF(Table3[User Id], <>0). Note if you have not formatted the data as a table, then you will need to replace Table3[User Id] with your range e.g. A2:A15 for column A and rows 2-15.
Filter ratings by a selected rating item value
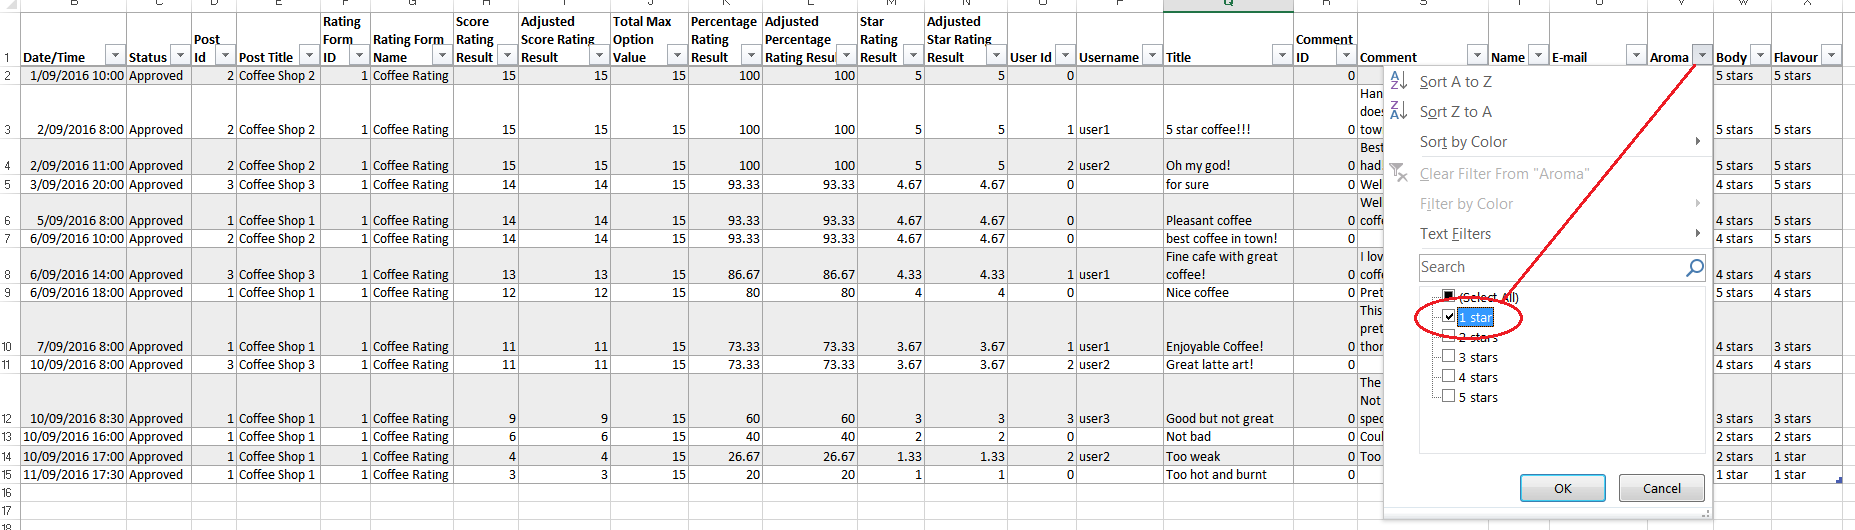
Add filters to the column headers, then filter by one of the rating item values. In the following example, all ratings where a user selected 1 star for the rating item Aroma will be filtered.
Create a report of ratings over time for specific posts
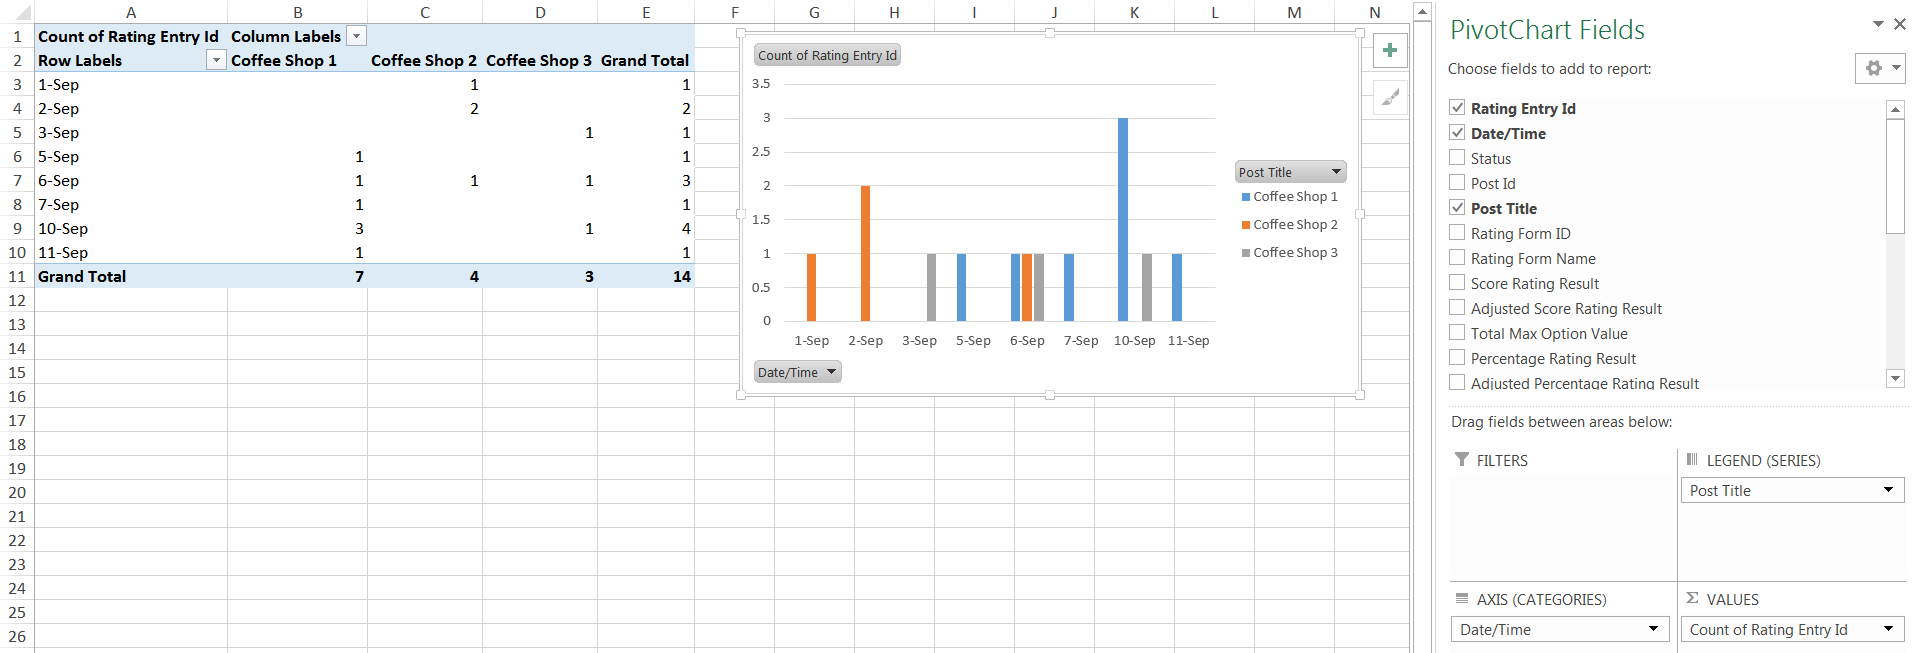
Create a new PivotChart using the Date/Time field as the x axis, Post Title as a column and a count of the Rating Entry Id field as the value. Then group the Date/Time field in the PivotTable by days.
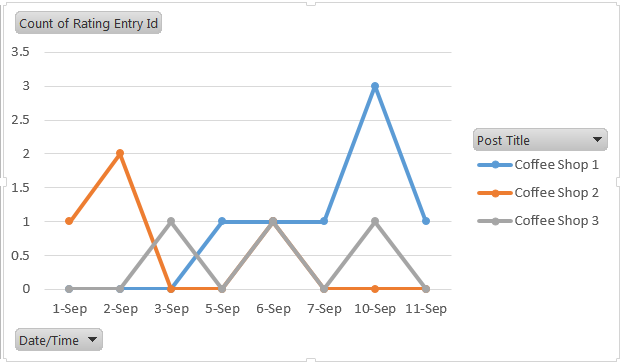
You can easily change the chart type. Here’s the same PivotTable shown as a line with markers chart.
Create a bar chart of selected rating item values for a specific rating form and post
Create a new PivotChart, add the Rating Form Id and Post Title fields as filters, set the the x axis to a rating item field and the value set to a count of the rating item field. This PivotChart will show how many users selected each rating item value, and you can easily filter by post and rating form.

Conclusion
Multi Rating Pro has a tool that allows you to export rating entries to a CSV file. As you have seen above, you can then quickly generate reports using spreadsheet software to visually present and analyse your data in meaningful ways.